

Image Details
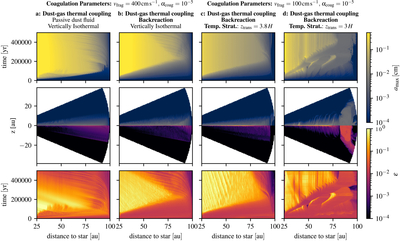
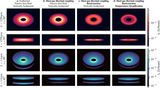
Caption: Figure D2.
Same as Figure 2 but for the four additional simulations. Columns (a) and (b) are the same simulation setup as columns (b) and (c) in Figure 2 and but with vfrag = 400 cm s−1. Columns (c) and (d) show simulations with different temperature stratification: in column (c), the transition height has been reduced to 3.8H; in column (d) it has been lowered to 3H.
Other Images in This Article
Show More
Copyright and Terms & Conditions
© 2026. The Author(s). Published by the American Astronomical Society.

Copyright ©
2026 Astronomy Image Explorer. All Rights Reserved.
