

Image Details
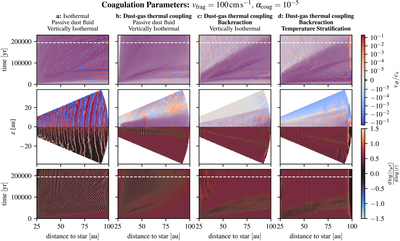
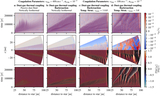
Caption: Figure 1.
Spacetime diagrams visualizing the effects of different physical processes on the time evolution of the VSI. The top row shows the evolution of the midplane polar Mach number in the disk’s midplane, which indicates the presence of the VSI’s corrugation mode. The third row shows the radial gradient of specific angular momentum at one pressure scale height distance from the midplane. A flat profile (black) indicates the saturated VSI modes. The central row shows simulation snapshots toward the end of the simulation (dashed horizontal lines in row one and three), showing the respective quantities throughout the simulation domain.
Other Images in This Article
Show More
Copyright and Terms & Conditions
© 2026. The Author(s). Published by the American Astronomical Society.

