

Image Details
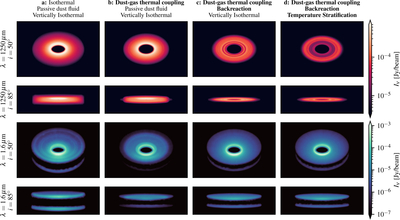
Caption: Figure 4.
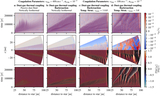
RADMC-3D models of our simulation data at 1.25 mm dust continuum (red color maps; rows one and two), and 1.6 µm wavelength, showing scattered light (blue color maps; rows three and four). Dust continuum images have been convolved with a beam identical to the observations published in M. Villenave et al. (2022); scattered light images have been convolved with a circular Gaussian beam with a 30 mas FWHM. The innermost 1 au of the images has been masked before the beam convolution.
Other Images in This Article
Show More
Copyright and Terms & Conditions
© 2026. The Author(s). Published by the American Astronomical Society.

Copyright ©
2026 Astronomy Image Explorer. All Rights Reserved.
