

Image Details
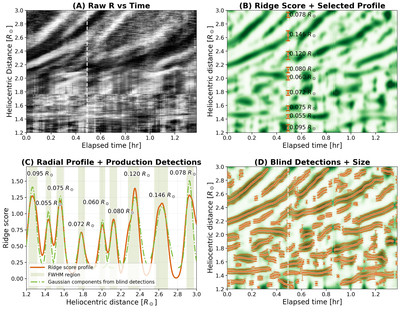
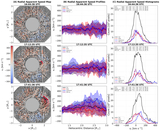
Caption: Figure 2.
Panel (A): raw H vs. T plot for PA = 83﹩\mathop{.}\limits^{{\unicode{x000b0}}}﹩5. The time highlighted in panels (b) and (c) is shown as a white line. Panel (B): ridge-score H vs. T plot to better reveal coherent ridges across time. The location of all of the detected ridge peaks as well as their width (shown by their orange marker) at the white time line in panel (A) is also shown. The number represents the physical size of the feature in units of solar radii. Panel (C): the intensity profile as a function of radius for the ridge-score panel for the same time. The smoothed intensity profile is shown as a solid line. The representative fitted Gaussians are shown as green dotted–dashed lines, with the FWHM of each Gaussian represented by the corresponding green shaded region. Panel (D): the full blind search across the ridge-score panel and all the resulting detected ridge locations.
Other Images in This Article
Copyright and Terms & Conditions
© 2026. The Author(s). Published by the American Astronomical Society.

