

Image Details
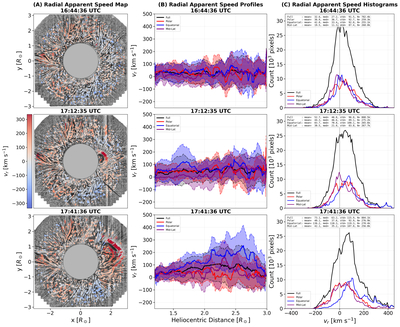
Caption: Figure 5.
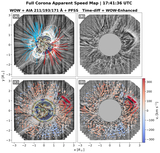
Summary results from three different times during Proba-3’s observing cycle on 2025 July 16. Left column: panel (A): a map of the radial apparent speed at the given time overlaid on the corresponding 5 minute time-difference images. Center column: panel (B): median radial apparent speed profiles for the polar (red), equatorial (blue), midlatitude (purple), and full azimuthal data (black) as a function of radial distance. The bands surrounding the median profiles represent the span of the radial apparent speed measurements limited to the ±1σ distribution. Right column: panel (C): distribution of apparent speeds for all the measurements (in counts). The different colors represent the same thing in panels (B) and (C). A animation of this figure is available. The animation runs from 16:41:36 to 18:04:08 UTC. Its real-time duration is 16 s.
(An animation of this figure is available in the online article.)
(An animation of this figure is available.)
The video/animation of this figure is available in the online journal.
Other Images in This Article
Copyright and Terms & Conditions
© 2026. The Author(s). Published by the American Astronomical Society.

