

Image Details
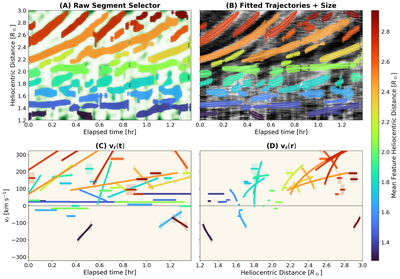
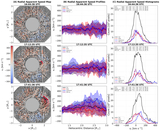
Caption: Figure 3.
Panel (A): ridge-score plot for PA = 83﹩\mathop{.}\limits^{{\unicode{x000b0}}}﹩5 described in Section 3.2, with grouped detections overlaid. Colors represent the features’ median height, allowing one to distinguish the linked feature segments identified by the tracking algorithm. Panel (B): corresponding raw H vs. T plot for the 5 minute differenced data, with the fitted trajectory for each segment overlaid. Panels (C) and (D): radial apparent speed profiles of each segment as a function of time and radial distance from the Sun, respectively.
Other Images in This Article
Copyright and Terms & Conditions
© 2026. The Author(s). Published by the American Astronomical Society.

Copyright ©
2026 Astronomy Image Explorer. All Rights Reserved.
