

Image Details
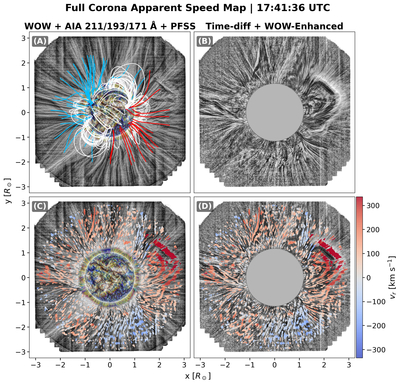
Caption: Figure 4.
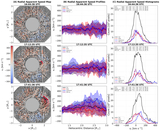
Top row: (A) WOW-enhanced image with an overlay of a composite AIA 211, 193, and 171 Å image and PFSS model and (B) 5 minute time-differenced WOW-enhanced image, as a function of radius and PA spanning 1.2 to 3.0 R⊙. Bottom row: panels (C) and (D) show corresponding apparent speed maps overlaid on images in panels (A) (without PFSS model) and (B) above. The color bar on the right is associated with the overlaid speed measurements for both panels (C) and (D). A animation of this figure is available. The animation runs from 16:41:36 to 18:04:08 UTC. Its real-time duration is 16 s.
(An animation of this figure is available in the online article.)
(An animation of this figure is available.)
The video/animation of this figure is available in the online journal.
Other Images in This Article
Copyright and Terms & Conditions
© 2026. The Author(s). Published by the American Astronomical Society.

