

Image Details
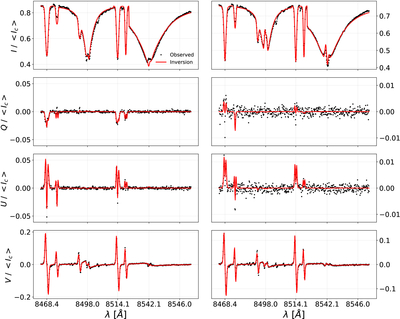
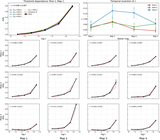
Caption: Figure 2.
Comparison between the observed and inverted Stokes profiles for two representative pixels, one located in Pore 1 (left) and the other in Pore 2 (right), with magnetic-field strengths of 1676 and 861 G at ﹩\mathrm{log}\tau =-2.0﹩, respectively. From top to bottom, the panels display the normalized Stokes I, Q, U, and V profiles. All Stokes profiles are expressed in units of the mean continuum intensity, 〈Ic〉. The black dots represent the observed SCIP spectra, whereas the red line shows the best-fit synthetic profile obtained from the simultaneous multiline inversion. The inversion includes the photospheric Fe I lines at 8468, 8471, 8497, 8514, and 8515 Å, together with the chromospheric Ca II lines at 8498 and 8542 Å. The very good agreement between the observed and synthetic profiles demonstrates the ability of the inversion to reproduce simultaneously the photospheric and chromospheric polarization signals over a broad range of magnetic-field strengths.
Other Images in This Article
Copyright and Terms & Conditions
© 2026. The Author(s). Published by the American Astronomical Society.

