

Image Details
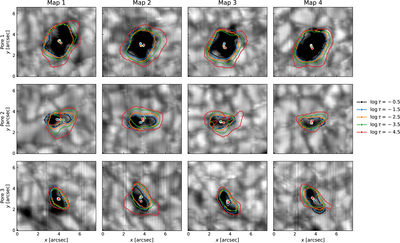
Caption: Figure 4.
Constant magnetic flux contours derived from the multiline inversions for the three pores analyzed in this work. Each row corresponds to a different pore, while the four columns show the four consecutive SCIP raster maps. The background grayscale image displays the Fe I 8468 Å continuum intensity (Δλ = −0.555 Å). Colored contours delineate the boundaries enclosing the same magnetic flux at optical depths ﹩\mathrm{log}\tau =-0.5﹩, −1.5, −2.5, −3.5, and −4.5, shown from black to red. The colored markers the flux-weighted centroid of each magnetic mask, using the same color coding as the corresponding contour. The progressive outward displacement of the constant-flux contours with decreasing optical depth reveals the systematic expansion of the magnetic field with height.
Other Images in This Article
Copyright and Terms & Conditions
© 2026. The Author(s). Published by the American Astronomical Society.

