

Image Details
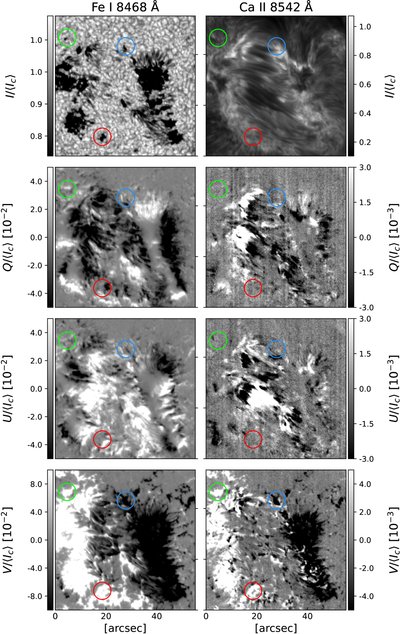
Caption: Figure 1.
Overview of the Sunrise III/SCIP observations analyzed in this letter. The field of view (FoV) covers approximately 58″ × 58″. The left column shows, from top to bottom, the Fe I 8468 Å continuum intensity map (Δλ = −0.551 Å), representative of the photosphere, followed by monochromatic Stokes Q, U, and V maps obtained at Δλ = −0.117 Å. The right column displays, from top to bottom, the Ca II 8542 Å line core intensity map (Δλ = −0.008 Å), sampling the chromosphere, followed by monochromatic Stokes Q and U maps obtained at Δλ = −0.087 Å and a Stokes V map obtained at Δλ = −0.403 Å. All Stokes maps are expressed in units of the mean continuum intensity, 〈Ic〉. The display ranges are intentionally saturated to enhance the visibility of small-scale structures, with the color bar limits indicating the adopted saturation levels. The red, green, and blue circles in all panels indicate the locations of Pores 1, 2, and 3, respectively. The x-axis corresponds to the slit direction, whereas the y-axis corresponds to the scan direction.
Other Images in This Article
Copyright and Terms & Conditions
© 2026. The Author(s). Published by the American Astronomical Society.

