

Image Details
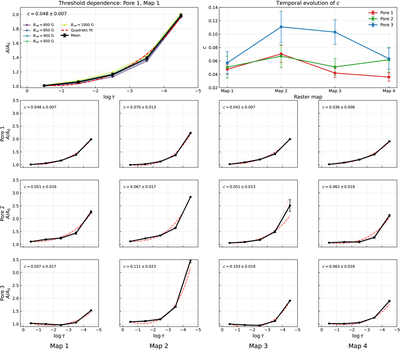
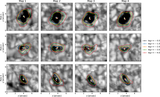
Caption: Figure 5.
Characterization of the magnetic expansion derived from the constant-flux analysis. The upper left panel illustrates the dependence of the expansion profile on the reference magnetic-field threshold used to define the reference magnetic mask at ﹩\mathrm{log}\tau =-0.5﹩, shown for Pore 1 in Map 1. Colored curves correspond to different reference thresholds, the black curve shows the mean expansion profile, and the red dashed line represents the quadratic fit used to quantify the expansion. The upper right panel displays the temporal evolution of the curvature parameter c (Equation (6)) for the three pores analyzed in this work. The remaining 12 panels show the mean expansion profiles for each pore (rows) and each SCIP raster map (columns), together with their corresponding curvature parameters. Black symbols indicate the measured expansion factor A/A0, while the error bars represent the standard deviation obtained from the threshold analysis. The red dashed curves correspond to the quadratic fits performed in logarithmic space. Larger values of c indicate a more rapid increase of the magnetic area with height.
Other Images in This Article
Copyright and Terms & Conditions
© 2026. The Author(s). Published by the American Astronomical Society.

