

Image Details
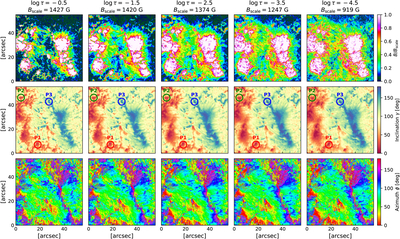
Caption: Figure 3.
Vector magnetic field inferred from the simultaneous multiline inversions. The columns correspond to five equally spaced optical depth layers from ﹩\mathrm{log}\tau =-0.5﹩ to –4.5. From top to bottom, the panels show the magnetic-field strength (B), inclination (γ), and azimuth (ϕ), respectively. The magnetic-field strength maps are normalized independently at each optical depth layer by the reference value Bscale, indicated above each panel. The red, green, and blue circles in the inclination maps indicate Pores 1, 2, and 3, respectively. No 180∘ azimuth disambiguation has been applied; the azimuth maps correspond directly to the values returned by the inversion. The sequence illustrates the spatially coherent evolution of the inferred magnetic-field vector across the sampled optical depth range.
Other Images in This Article
Copyright and Terms & Conditions
© 2026. The Author(s). Published by the American Astronomical Society.

