

Image Details
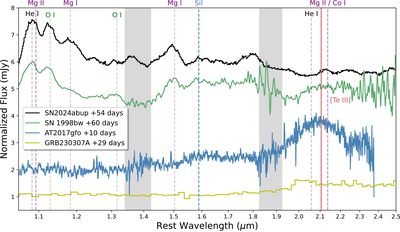
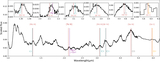
Caption: Figure 8.
Comparison of the NIR spectrum of SN 2024abup at +41 days with SN 1998bw (F. Patat et al. 2001), AT 2017gfo (E. Pian et al. 2017), and GRB 230307A (A. J. Levan et al. 2024). Similar lines are seen for both SN 1998bw and SN 2024abup. The [Te III] line is identified in AT2017gfo and GRB 230307A as a signature of r-process element production. There is a bump in SN 2024abup near the [Te III]; however, there could be Mg II present there as well.
Other Images in This Article
Show More
Copyright and Terms & Conditions
© 2026. The Author(s). Published by the American Astronomical Society.

Copyright ©
2026 Astronomy Image Explorer. All Rights Reserved.
