

Image Details
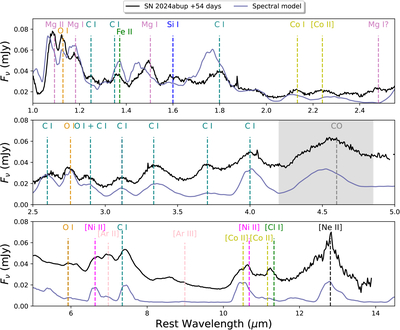
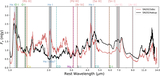
Caption: Figure 6.
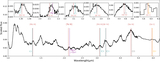
SN 2024abup compared to model from SUMO. The model is able to reproduce several observed spectral features. However, there are differences in the strength, which is expected as this model is not fine-tuned for this particular case. Overall, the observed continuum is higher than the model for wavelengths greater than ∼3 μm, which could be due to the presence of dust in the SN or the host galaxy or both, which is not included in the model. The shaded region in red shows the CO feature predicted by the model and the observed spectral feature in the same wavelength regime.
Other Images in This Article
Show More
Copyright and Terms & Conditions
© 2026. The Author(s). Published by the American Astronomical Society.

Copyright ©
2026 Astronomy Image Explorer. All Rights Reserved.
