

Image Details
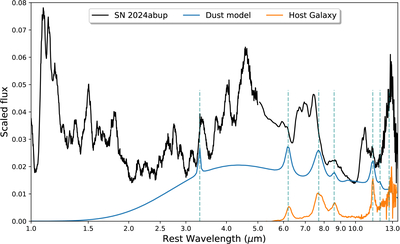
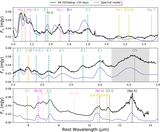
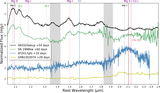
Caption: Figure 10.
SN 2024abup spectrum (black) along with the model of graphite, silicate, and PAH contribution (blue) and the host galaxy (orange). The prominent PAH lines, contributed mainly by the host galaxy, are identified by dashed teal lines. There is a clear excess in the continuum of SN 2024abup compared to the host galaxy spectrum.
Other Images in This Article
Show More
Copyright and Terms & Conditions
© 2026. The Author(s). Published by the American Astronomical Society.

Copyright ©
2026 Astronomy Image Explorer. All Rights Reserved.
