

Image Details
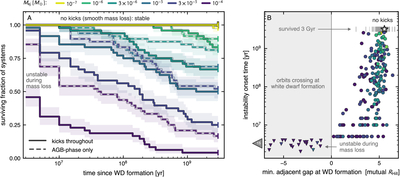
Caption: Figure 4.
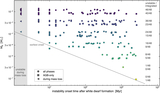
Survival of the outer solar system under stochastic mass loss. Panel (A) shows the fraction of systems remaining stable versus time since white dwarf formation, per Mej (colors; solid: ejections throughout the giant-branch phases; dashed: AGB-only), from 3 Gyr integrations without external perturbers. Each curve follows the 48 realizations of each cell; systems that go unstable during the mass loss itself enter the plot at a correspondingly reduced t = 0 survival value, and onset times are resolved at the 5 Myr cadence of the stability diagnostics. Shaded bands show the 68% statistical (Wilson) uncertainty of each curve (48 systems per curve); the 3 × 10⁻⁷ M⊙ curves, statistically indistinguishable from 10−7 M⊙, are omitted for clarity. Panel (B) depicts the instability onset time versus the minimum adjacent Hill-unit separation of the end state; negative separations denote pairs already reordered or crossing at white dwarf formation. Downward triangles mark systems destabilized during mass loss itself; the count-bearing triangle beyond the left edge tallies the 15 such systems crossing more deeply than the plotted range, and the star marks the unkicked, adiabatically expanded solar system.
Other Images in This Article
Copyright and Terms & Conditions
© 2026. The Author(s). Published by the American Astronomical Society.

