

Image Details
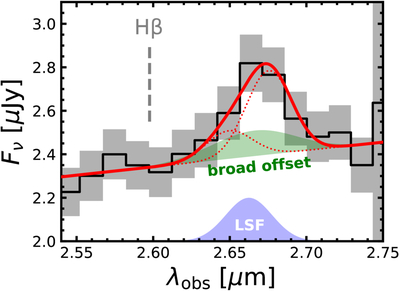
Caption: Figure 11.
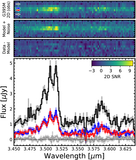
NIRSpec/PRISM zoom-in on the [O III] doublet and nondetection of Hβ. The red line shows a model fitting only narrow [O III], but this fit is dominated by the PRISM line-spread function (blue). The expected offset broad component for [O III] based on the G395M Hα profile is shown as a shaded green region, which can be added to the model but with no discriminatory power given the resolution.
Other Images in This Article
Show More
Copyright and Terms & Conditions
© 2026. The Author(s). Published by the American Astronomical Society.

Copyright ©
2026 Astronomy Image Explorer. All Rights Reserved.
