

Image Details
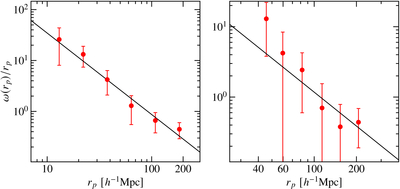
Caption: Figure 4.
Projected autocorrelation function for quasars at 4.7 ≤ z < 5.4 (left) and 5.6 ≤ z < 6.3 (right). The red dots represent the measurements of the projected autocorrelation, and the black solid line stands for the best-fit model.
Other Images in This Article
Copyright and Terms & Conditions
© 2026. The Author(s). Published by the American Astronomical Society.

Copyright ©
2026 Astronomy Image Explorer. All Rights Reserved.
