

Image Details
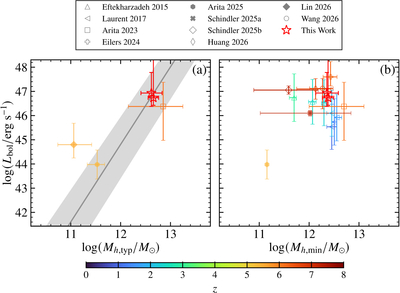
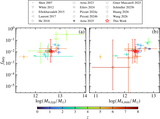
Caption: Figure 6.
The scaling relation between the observed quasar bolometric luminosity and its derived host halo mass: (a) typical mass, (b) minimum mass. The error bars of Lbol represent the observed range of the quasar luminosity, while the error bars of Mh denote the measurement uncertainties. The gray solid line and shaded region in panel (a) represent the theoretical Lbol–Mtyp relation at z ≈ 6 from simulations (E. Pizzati et al. 2024b).
Other Images in This Article
Copyright and Terms & Conditions
© 2026. The Author(s). Published by the American Astronomical Society.

Copyright ©
2026 Astronomy Image Explorer. All Rights Reserved.
