

Image Details
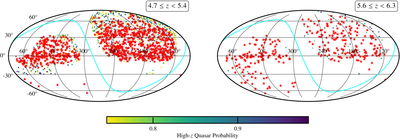
Caption: Figure 3.
The sky distribution of quasars at 4.7 ≤ z < 5.4 (left) and 5.6 ≤ z < 6.3 (right). The color coding denotes the predicted probability of being a true high-z quasar obtained in G. Ye et al. (2024) for the candidates. Red stars represent the spectroscopically confirmed quasars within the same redshift range. The cyan solid line represents the Galactic plane.
Other Images in This Article
Copyright and Terms & Conditions
© 2026. The Author(s). Published by the American Astronomical Society.

Copyright ©
2026 Astronomy Image Explorer. All Rights Reserved.
