

Image Details
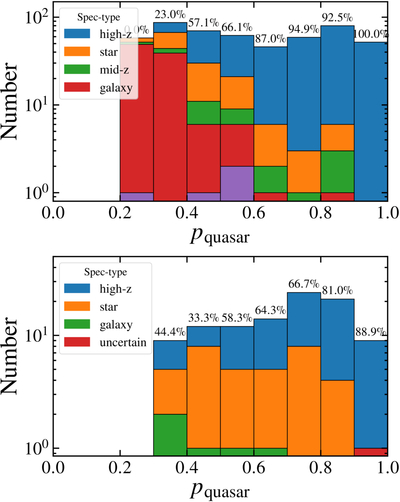
Caption: Figure 1.
The classification performance of the candidates with DESI spectroscopic observations as a function of the predicted probability of the “high-z” class for the redshift interval of 4.7 ≤ z < 5.4 (top, z-band magnitude <21.4) and 5.6 ≤ z < 6.3 (bottom, z-band magnitude <21.0). The fraction shown above each bar is the proportion of these “high-z” objects among all observed candidates in the corresponding bin.
Other Images in This Article
Copyright and Terms & Conditions
© 2026. The Author(s). Published by the American Astronomical Society.

Copyright ©
2026 Astronomy Image Explorer. All Rights Reserved.
