

Image Details
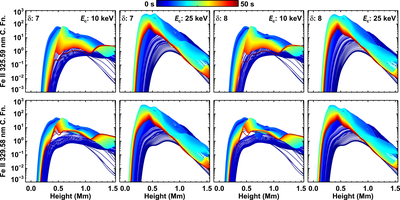
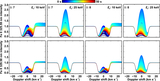
Caption: Figure B2.
Spectral line formation with height. Contribution functions, normalized to the initial quiet-Sun values, as a function of height are plotted for the grid of RADYN simulations (upper panels: Fe II 325.59 nm line core; lower panels: Fe II 329.58 nm line core). The colors have the same meaning as in Figure B1.
Other Images in This Article
Copyright and Terms & Conditions
© 2026. The Author(s). Published by the American Astronomical Society.

Copyright ©
2026 Astronomy Image Explorer. All Rights Reserved.
