

Image Details
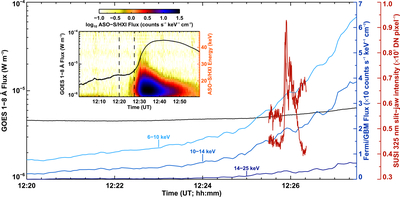
Caption: Figure 2.
Multiwavelength signatures in the early phase of the flare. Disk-integrated GOES soft X-ray flux (black) and Fermi/GBM hard X-ray flux in three energy bins (shades of blue) are plotted as a function of time. The maroon-colored light curves are the early flare-related impulses that SUSI captured (same as the yellow and orange curves in Figure 1). In the inset, an ASO-S/HXI background-subtracted spectrogram (energy versus time) is shown along with an overlay of the time series of GOES X-ray flux (black). The two vertical dashed lines in the inset mark the temporal boundaries of the main plot.
Other Images in This Article
Copyright and Terms & Conditions
© 2026. The Author(s). Published by the American Astronomical Society.

Copyright ©
2026 Astronomy Image Explorer. All Rights Reserved.
