

Image Details
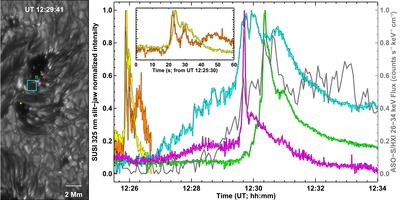
Caption: Figure 1.
Lower atmospheric small-scale response in the pre- and impulsive phases of the flare. Left: SUSI slit-jaw image covering a footpoint region of the flare. The various colored boxes point to locations of flare ribbons. Right: normalized emission as a function of time, averaged over the corresponding colored boxes identified in the left panel. The gray curve is the background-subtracted ASO-S/HXI hard X-ray flux in the 26–34 keV energy range. In the inset, we show the zoomed-in view of the yellow and orange light curves.
Other Images in This Article
Copyright and Terms & Conditions
© 2026. The Author(s). Published by the American Astronomical Society.

Copyright ©
2026 Astronomy Image Explorer. All Rights Reserved.
