

Image Details
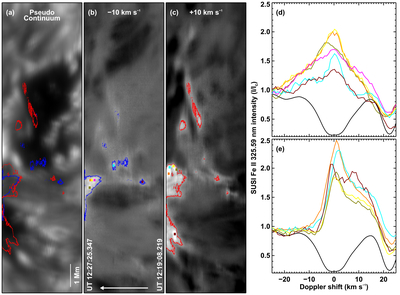
Caption: Figure 3.
Lower atmospheric imprints of flare ribbons. Pseudo-continuum (a), blue-wing map (b), and red-wing map (c) around the Fe II 325.59 nm line are displayed. The blue (red) colored contours enclose regions with enhanced blue (red)-wing enhancements. In panel (b), the timestamps mark the beginning and end of the displayed raster, while the scan direction is indicated by the arrow. Sample spectral lines from regions showing blue-wing (d) and red-wing (e) enhancements are plotted as a function of Doppler shift. These profiles are normalized to their local continua. Spatial locations of the profiles are marked with the respective colored boxes, separately, in panels (b) and (c). The black curve in both panels is the same, showing the average quiet-Sun spectral profile, normalized to the continuum.
Other Images in This Article
Copyright and Terms & Conditions
© 2026. The Author(s). Published by the American Astronomical Society.

