

Image Details
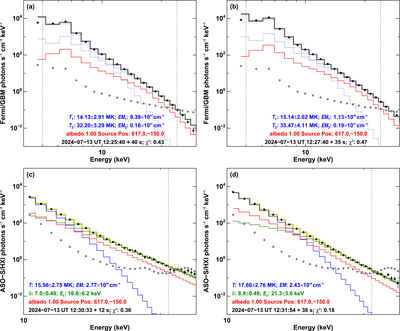
Caption: Figure 5.
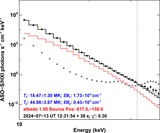
Hard X-ray diagnostics for various time periods during the flare. (a) The background-subtracted Fermi/GBM HXR photon flux as a function of energy, integrated over the specified time period, is plotted with black symbols. The error bars represent 1σ uncertainties. The background spectrum is denoted by gray symbols. The blue curve is the two-component isothermal model fitted to the observations with the corresponding fit parameters, temperature T, and the emission measures EM, listed. Individual components are shown as dotted blue (lower T) and solid thin blue (higher T) curves. Albedo, with the source position defined in Helioprojective Cartesian coordinates, is plotted in red. The yellow curve is the total fit. The goodness of the fit (χ2) is also quoted. The dotted vertical lines denote the energy range considered for spectral fitting. (b) Same as panel (a) but plotted for a different time interval. In panels (a) and (b), blue and yellow curves nearly overlap. (c) The black and gray symbols have the same meaning as in panel (a) but are obtained from the ASO-S/HXI observations. Isothermal (blue) and thick-target (green) models fitted to the data and the source albedo (red), and the total fit (yellow) are overplotted. Various fit parameters (T, EM, spectral index δ, and the low-energy cutoff Ec) are listed. (d) Same as panel (c), but plotted for a different time period.
Other Images in This Article
Copyright and Terms & Conditions
© 2026. The Author(s). Published by the American Astronomical Society.

