

Image Details
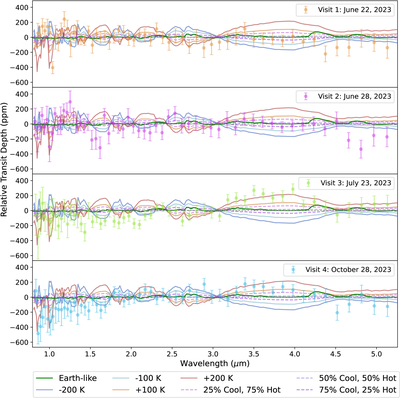
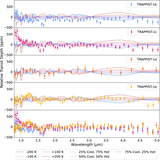
Caption: Figure 5.
Visit-to-visit variability of TRAPPIST-1 e transmission spectra compared with TLS-effect models for a hot, cold, and mixed active region along with a representative Earth-like terrestrial atmosphere model (dark green). While none of the models fit the data across all wavelengths, some trends can be seen. For example, Visit 3, which has a midtransit flare, shows broadly more agreement with the hotter models compared with the quieter first two visits, in particular between 3 and 4.5 μm.
Other Images in This Article
Copyright and Terms & Conditions
© 2026. The Author(s). Published by the American Astronomical Society.

Copyright ©
2026 Astronomy Image Explorer. All Rights Reserved.
