

Image Details
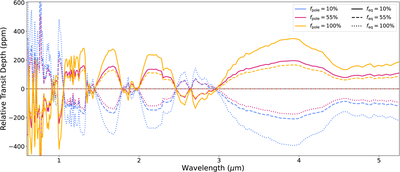
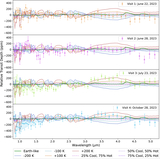
Caption: Figure 3.
Degeneracy between filling-factor differences between the polar and equatorial regions and the temperature contrast (Figure 1). Each curve shows the error in transit depth due to the TLS effect for an assumed polar filling factor (fpole; line color) and equatorial filling factor (feq; line style). For example, the solid yellow line has 100% filling factor at the poles (yellow) and 10% filling factor at the equator (solid line). This degeneracy makes it challenging to fit simple temperature and filling-factor models with observed data.
Other Images in This Article
Copyright and Terms & Conditions
© 2026. The Author(s). Published by the American Astronomical Society.

Copyright ©
2026 Astronomy Image Explorer. All Rights Reserved.
