

Image Details
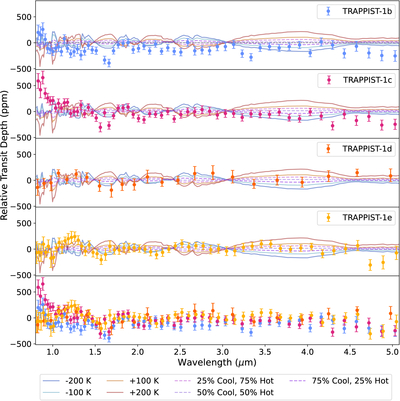
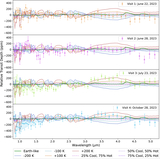
Caption: Figure 4.
Planet-to-planet comparison of observed single-transit low-b planet spectra with TLS-effect models. Transit depth in parts-per-million (ppm) is shown on the y-axis and wavelength is shown in microns on the x-axis. The top four panels show JWST NIRSpec/PRISM data for the inner planets individually compared with a range of expected contamination models while the lowest panel shows the planetary spectra compared with each other. We show models using cool active regions, hot active regions, and mixtures of hot and cold active regions. While the minimal models alone cannot provide a fit to the data that would allow for TLS mitigation, they can inform on planet-to-planet trends.
Other Images in This Article
Copyright and Terms & Conditions
© 2026. The Author(s). Published by the American Astronomical Society.

