

Image Details
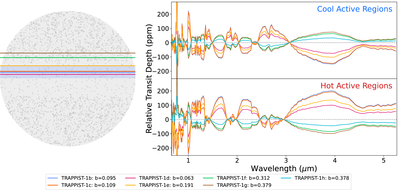
Caption: Figure 1.
Differences in the TLS effect for the TRAPPIST-1 planets for our minimal two-zone model. The left panel shows a representative diagram of the stellar surface with increased spottedness in the polar regions. Lines are drawn to represent the center of the transit chord for each of the TRAPPIST-1 planets. As a representative example, the width of planet b’s transit chord is shaded in blue. In the right panel, the relative transit depth is shown assuming only stellar heterogeneity made up of cooler regions (upper) and hotter regions (lower) with no contribution from a planetary atmosphere over the wavelength range relevant to JWST NIRSpec/PRISM. The higher-impact-parameter planets (f, g, and h) are less impacted by the TLS effect than the lower-impact-parameter planets given our choice of zonal boundary.
Other Images in This Article
Copyright and Terms & Conditions
© 2026. The Author(s). Published by the American Astronomical Society.

