

Image Details
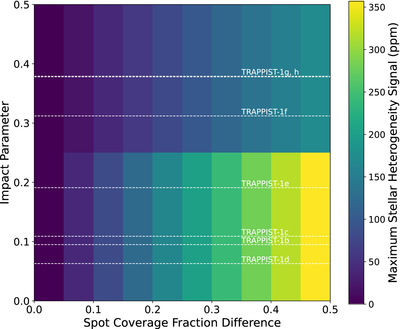
Caption: Figure 2.
The maximum peak-to-peak amplitude of the TLS effect over a range of impact parameters and spot-coverage fractional differences between the polar and equatorial regions for our fiducial two-zone model. As a representative example, we assume cold spots (ΔT = −100 K) and an equatorial band up to 15∘. We fix fpole to 0.5 and allow feq to range from 0 to 0.5. The inner (low-b) planets demonstrate up to ∼2 × the TLS as the outer planets.
Other Images in This Article
Copyright and Terms & Conditions
© 2026. The Author(s). Published by the American Astronomical Society.

Copyright ©
2026 Astronomy Image Explorer. All Rights Reserved.
