

Image Details
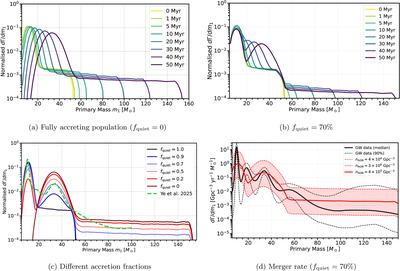
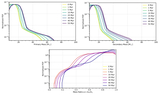
Caption: Figure 5.
Probability distribution of the gravitational-wave merger rate as a function of primary mass. The distributions are derived from the evolving compact-object populations shown in previous sections and therefore represent the observable consequences of accretion-driven transport through mass space. Top left (a): evolution of a fully accreting population, illustrating the progressive development of a high-mass merger tail. Top right (b): population consisting of 70% nonaccreting and 30% accreting binaries. Lower left (c): merger-rate distributions after 50 Myr for different fractions of nonaccreting systems, fquiet. Mixed populations naturally produce multicomponent merger distributions whose relative amplitudes trace the fraction of binaries embedded in long-lived gas reservoirs. Lower right (d): merger rate per primary mass as derived from our model after 50 Myr, assuming that 70% of the population are nonaccreting binaries, and the rest are accreting. The shaded region describes different choices of nAGN in the range 4 × 10⁴−3 × 10⁶ Gpc−3 compared to the LVK-inferred rate; the 90th percentile is shown as dashed lines (as adopted from Y. B. Ginat et al. 2026).
Other Images in This Article
Copyright and Terms & Conditions
© 2026. The Author(s). Published by the American Astronomical Society.

