

Image Details
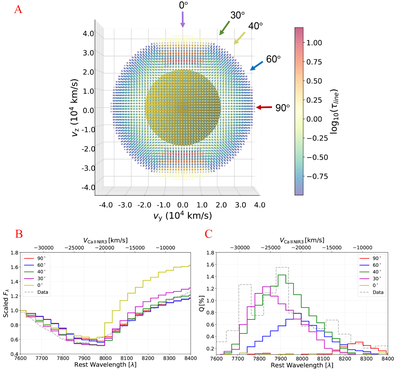
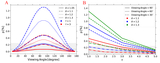
Caption: Figure A3.
Investigating the viewing-angle dependence from the flux and polarization profiles across the Ca II NIR3 feature. Panel (A) illustrates the opacity enhancement within a cone-shaped region as described in the text. Panel (B) compares the observed spectral profile with a series of model-synthesized flux density (Fλ) as observed at different inclination angles as indicated by the legend. The corresponding polarization spectra projected onto the Q-axis are presented in panel (C). Velocities measured with respect to the center wavelength of Ca II NIR3 can be read off the top abscissas. Small fluctuations in the histograms that show the simulation results are due to Monte Carlo statistical noise.
Other Images in This Article
Copyright and Terms & Conditions
© 2026. The Author(s). Published by the American Astronomical Society.

