

Image Details
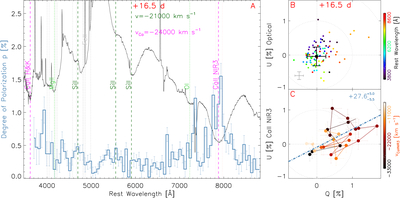
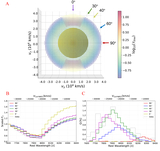
Caption: Figure 2.
Panel (A): intrinsic polarization of SN 2026gzf at day 16.5. The debiased degree of polarization, p, calculated using Equation (2), is shown as a navy histogram with 60 Å binning, together with the full-resolution, arbitrarily scaled flux spectrum (Fλ; black line). All narrow spikes originate from an underlying nebulosity. Vertical lines identify several major spectral features. Panel (B): polarization of SN 2026gzf displayed on the Stokes Q − U plane. The top panel presents the data between rest-frame wavelengths of 3800 and 8800 Å, with a 60 Å bin size adopted for clarity. The wavelength of each bin can be read from the color bar at the right. The solid black circle close to the origin identifies the continuum polarization deduced over the wavelength range of 6400–7100 Å. Panel (C) has a similar layout as the top panel but is restricted to the Ca II NIR3 profile from blueshifted velocities ranging from 33,000 to 3000 km s−1 with a 30 Å spectral binning. The navy dotted–dashed line is a fit to the displayed data points, whose orientation in degrees with uncertainties is indicated by the navy text.
(The data used to create this figure are available in the online article.)
(The data used to create this figure are available.)
Other Images in This Article
Copyright and Terms & Conditions
© 2026. The Author(s). Published by the American Astronomical Society.

