

Image Details
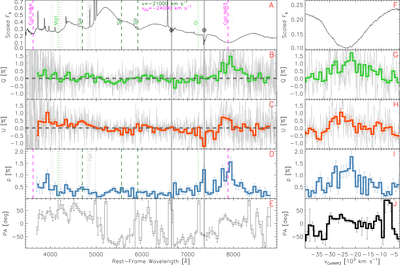
Caption: Figure 1.
Spectropolarimetry of SN 2026gzf at 16.5 days after the X-ray shock breakout. The left column (from top to bottom) shows (A) the arbitrarily scaled total-flux spectrum with major spectral lines identified (telluric features are indicated with an Earth symbol; all narrow spikes originate from an underlying nebulosity); (B), (C) the intensity-normalized Stokes parameters Q and U, with zero level indicated by the horizontal gray dashed lines; (D) the polarization spectrum (p); and (E) the polarization position angle. A 60 Å bin size is used in panels (B)–(E) for clarity. The right column displays the Ca II NIR3 absorption profile; panels (G)–(J) show the polarization as a function of blueshifted velocity relative to the central rest wavelength of Ca II NIR3 at 8567 Å using 30 Å bins for clarity. The light gray curves show the Stokes Q and U parameters sampled under the VLT FORS2 pixel scale resulting from our instrument setup, namely ≈3.3 Å pixel−1. The p displayed in (D), (I) are the debiased polarization degree, calculated using Equation (2).
(The data used to create this figure are available in the online article.)
(The data used to create this figure are available.)
Other Images in This Article
Copyright and Terms & Conditions
© 2026. The Author(s). Published by the American Astronomical Society.

