

Image Details
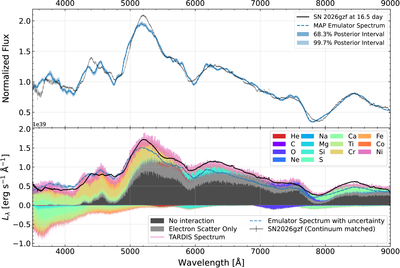
Caption: Figure A1.
The maximum-a-posteriori (MAP) emulator spectrum (top, navy curve) compared to the day 16.5 VLT spectrum of SN 2026gzf (top, black curve). Narrow emission lines from underlying nebulosity were manually interpolated for the purpose of spectral modeling. The bottom panel compares the emulator spectra (navy dashed line) and the TARDIS simulation (pink solid line) evaluated with the MAP parameter set. The continuum-matched observed spectrum of SN 2026gzf is presented in black for comparison. The color-shaded spectra illustrate the elemental decomposition of the TARDIS simulation. Black- and gray-shaded areas show contributions from noninteracting photons and those interacting only through electron scattering, respectively.
Other Images in This Article
Copyright and Terms & Conditions
© 2026. The Author(s). Published by the American Astronomical Society.

