

Image Details
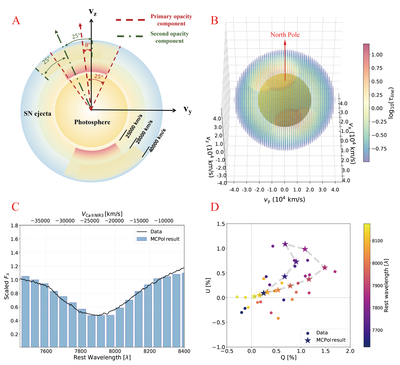
Caption: Figure 3.
Panel (A): schematic illustration of the two-component Ca II opacity distribution. Symmetry axes of the primary (25,000–40,000 km s−1) and secondary (28,000–40,000 km s−1) components, which are located above the photosphere, are indicated by red and green arrows, respectively. The symmetry axis of the primary component has an 8∘ inclination angle relative to the vz-axis, while the secondary component has an inclination angle relative to the vz-axis of 25∘. The difference between the two components is thus 17∘. Panel (B): 3D map of the Ca II opacity viewed at a 40∘ angle relative to the vz-axis. The radius of the inner sphere centered at the origin indicates the size of the photosphere. The optical depth of the Ca II is presented in a logarithmic scale and color-coded as indicated by the color bar on the right-hand side. Overlapping primary and secondary components create a high-optical-depth region covering the northern pole, where the opacity increases radially inward. Southern components are obscured behind the photosphere, visible as the dark-red shaded area in the lower hemisphere. Panel (C): the model-synthesized flux spectrum of Ca II NIR3 (blue histograms) for the opacity distribution illustrated in Panel (B) compared to the observation (black curve). Both spectra have been normalized to match the continuum flux measured from adjacent wavelength ranges. Panel (D): the model polarization modulation across the Ca II NIR3 line profile induced by the opacity distribution presented in panel (B) compared to the observations shown in Figure 2(C). Polarization at different wavelengths is indicated by the color bars to the right.
Other Images in This Article
Copyright and Terms & Conditions
© 2026. The Author(s). Published by the American Astronomical Society.

