

Image Details
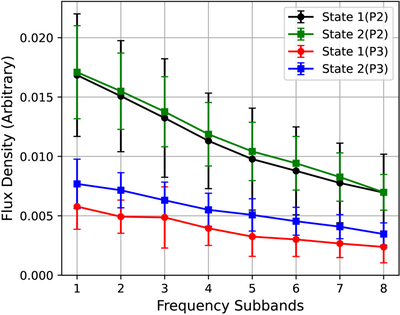
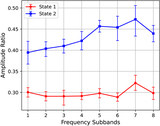
Caption: Figure 9.
Energy spectra of the P2 and P3 components in the two profile states. Black/green points show the P2 spectrum in state 1/state 2, and blue/red points show the P3 spectrum in state 1/state 2. Each colored data point represents the mean value of its corresponding subband, with error bars indicating the 1σ standard deviation.
Other Images in This Article
Show More
Copyright and Terms & Conditions
© 2026. The Author(s). Published by the American Astronomical Society.

Copyright ©
2026 Astronomy Image Explorer. All Rights Reserved.
