

Image Details
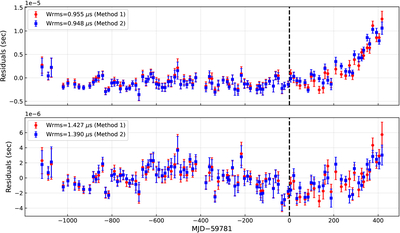
Caption: Figure 10.
Timing residuals from timing model fitting of TOAs derived from two distinct methods. The top panel shows the timing residuals obtained by fitting only the TOAs measured before MJD 59781, with the WRMS value calculated from the pre-MJD 59781 TOAs alone. The bottom panel presents the timing residuals from fitting the full set of TOAs, and the corresponding WRMS is computed using all available TOAs. Red and blue points represent the results derived from TOAs measured using Method 1 and Method 2, respectively. The black vertical dashed lines in both panels mark the epoch of the abrupt profile transition.
Other Images in This Article
Show More
Copyright and Terms & Conditions
© 2026. The Author(s). Published by the American Astronomical Society.

