

Image Details
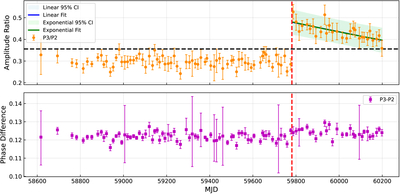
Caption: Figure 3.
Temporal evolution of the peak flux amplitude ratio and peak phase difference between P2 and P3. The red vertical line in both panels marks the epoch of the abrupt profile transition. In the top panel, the black horizontal line denotes the threshold separating the two states. The blue curve with light blue shading shows the linear fit and its 95% confidence interval, while the green curve with light green shading shows the exponential fit and its 95% confidence interval. The two fits nearly overlap due to their highly consistent fitting results.
Other Images in This Article
Show More
Copyright and Terms & Conditions
© 2026. The Author(s). Published by the American Astronomical Society.

Copyright ©
2026 Astronomy Image Explorer. All Rights Reserved.
