

Image Details
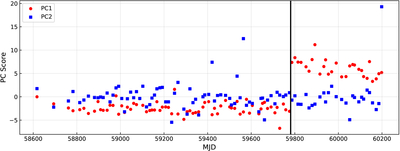
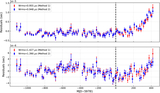
Caption: Figure 6.
Temporal evolution of the PCA scores for the first two principal components. The PC1 scores (red circles) show an abrupt step-like increase at the profile transition epoch MJD 59781, followed by a long-term linear declining trend. In contrast, the PC2 scores (blue squares) remain nearly constant with no significant variation throughout the entire observational span. A few outlying PC2 points stem from relatively low-S/N observations, consistent with statistical fluctuations and irrelevant to the core evolutionary trend. This demonstrates that the profile transition and its subsequent recovery are dominated by the PC1 mode.
Other Images in This Article
Show More
Copyright and Terms & Conditions
© 2026. The Author(s). Published by the American Astronomical Society.

