

Image Details
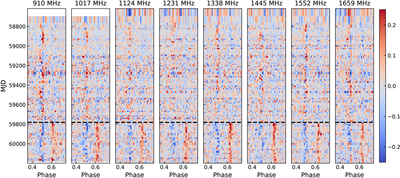
Caption: Figure 7.
Profile residual evolution for different subbands. In each panel, the black horizontal line marks the epoch of the sudden profile transition. Regions shown in red correspond to flux stronger than the median template, while blue indicates flux weaker than the median template. For time intervals with no available observations, we interpolate the profile using the most recent preceding observation.
Other Images in This Article
Show More
Copyright and Terms & Conditions
© 2026. The Author(s). Published by the American Astronomical Society.

Copyright ©
2026 Astronomy Image Explorer. All Rights Reserved.
