

Image Details
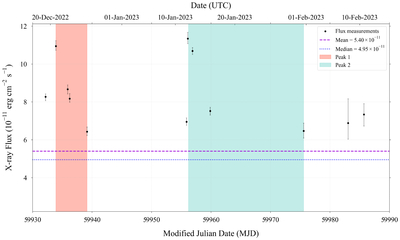
Caption: Figure 3.
Zoomed-in view of the peak at 60000 MJD highlighted in Figure 1. The large peak at 60000 MJD is composed of two smaller subregions, which are highlighted in red and blue, respectively. Each of the two peaks was analyzed for similarities to the known behavior of a tidal disruption event. The highlighted regions span the maximum to minimum values of the decay regions of each peak. The graph still displays NGC 1275 X-ray flux (in erg cm−2s−1) versus time (in MJD). The purple line corresponds to the mean flux value, and the blue line corresponds to the median flux.
Other Images in This Article
Copyright and Terms & Conditions
© 2026. The Author(s). Published by the American Astronomical Society.

Copyright ©
2026 Astronomy Image Explorer. All Rights Reserved.
