

Image Details
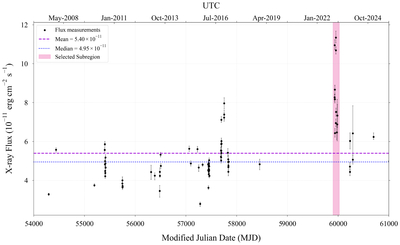
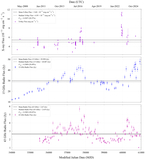
Caption: Figure 1.
NGC 1275 X-ray flux (in erg cm−2 s−1) versus time (in MJD). 1σ flux errors are shown. The purple line corresponds to the mean flux value over this time period, and the blue line corresponds to the median flux during the same time period. The large flare around MJD 60000 is highlighted in pink.
Other Images in This Article
Copyright and Terms & Conditions
© 2026. The Author(s). Published by the American Astronomical Society.

Copyright ©
2026 Astronomy Image Explorer. All Rights Reserved.
