

Image Details
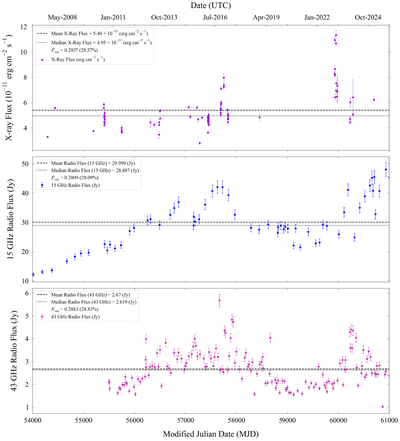
Caption: Figure 6.
The Swift/XRT, MOJAVE, and VLBA-BU-BLAZAR light curve of NGC 1275 over the same time span. The MOJAVE data are based on observations made using the VLBA at 15 Ghz (M. L. Lister et al. 2018). The VLBA-BU-BLAZAR data are based on observations made using the VLBA at 43 GHz (Z. R. Weaver et al. 2022). The X-ray and radio data have roughly the same fractional variability over similar time frames. The X-ray flare near MJD 60000 does not have a clear counterpart in the radio data, but it is notable that contemporaneous radio flux points are below the local mean and median values. The subsequent increase in radio flux density over ∼1000 days could be tied to the X-ray flare, if the flare marked a sudden increase in the mass accretion rate onto the black hole that subsequently propagated into the jet.
Other Images in This Article
Copyright and Terms & Conditions
© 2026. The Author(s). Published by the American Astronomical Society.

