

Image Details
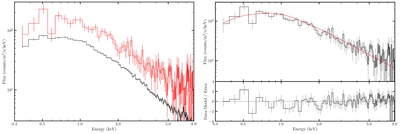
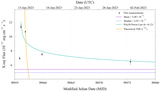
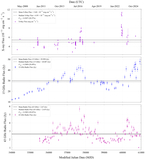
Caption: Figure 2.
Left: Swift/XRT spectra of the Perseus Cluster and NGC 1275, illustrating variability in the AGN. A time-averaged spectrum is shown in black. The brightest single observation is shown in red (ObsID 34765023). Right: the difference spectrum (ObsID 34765023 minus the time-averaged spectrum), fit with an absorbed Γ = 1.7 power-law over the band with sufficient signal.
Other Images in This Article
Copyright and Terms & Conditions
© 2026. The Author(s). Published by the American Astronomical Society.

Copyright ©
2026 Astronomy Image Explorer. All Rights Reserved.
