

Image Details
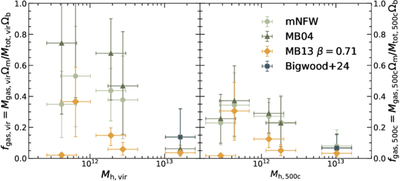
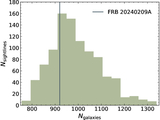
Caption: Figure 6.
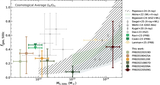
The halo gas fraction for our FRB sample plotted for a subset of the profiles considered. The left plot shows the gas fraction within Rvir, fgas,vir, and the right shows the gas fraction within R500c, fgas,500c. For clarity, we only plot our fiducial profile (mNFW) and the highest and lowest predicting profiles (excluding NFW). We also plot the L. Bigwood et al. (2024) profile for FRB 20240209A to show that it is consistent. Varying the radial profile between the several analytic forms considered introduces an uncertainty that is comparable to or smaller than the uncertainty from DM modeling. Our conclusions are robust to these changes.
Other Images in This Article
Copyright and Terms & Conditions
© 2026. The Author(s). Published by the American Astronomical Society.

