

Image Details
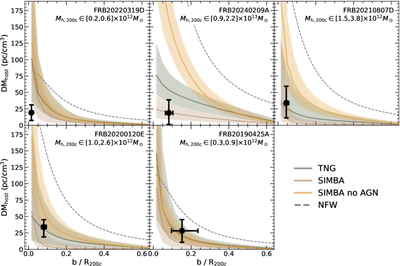
Caption: Figure 4.
DMhost vs. normalized impact parameter through the halo b⊥/R200c. Each panel shows the measurement from an FRB in our sample (in black) and randomly selected halos from simulations within 0.2 dex of the FRB host Mh,200c. We show three simulations: TNG50 (D. Nelson et al. 2019), SIMBA (R. Davé et al. 2019), and SIMBA with AGN feedback turned off. Solid lines are the median values, and shaded regions are the 16th and 84th percentile intervals, capturing both sight line-to-sight line variance within each halo and halo-to-halo variance. The x-axis uncertainty includes the FRB localization uncertainty and the uncertainty on host halo mass. The dashed gray curve is the DM computed analytically for a halo gas profile exactly following the NFW profile at the nominal host halo mass with the cosmological average baryon fraction.
Other Images in This Article
Copyright and Terms & Conditions
© 2026. The Author(s). Published by the American Astronomical Society.

