

Image Details
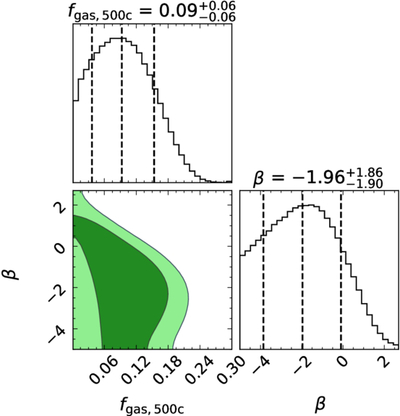
Caption: Figure 8.
Corner plot of the MCMC fit to our FRB sample. α is the inner power-law slope of the CGM radial profile. The contours represent the 1σ and 2σ confidence intervals. The sample is not large enough for a good constraint on α, but the fit demonstrates that there is constraining power in the data that can be taken advantage of with a future larger sample.
Other Images in This Article
Copyright and Terms & Conditions
© 2026. The Author(s). Published by the American Astronomical Society.

Copyright ©
2026 Astronomy Image Explorer. All Rights Reserved.
