

Image Details
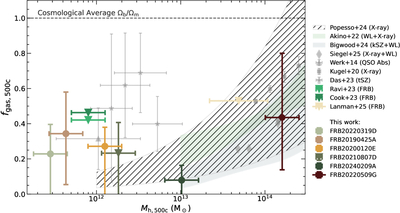
Caption: Figure 7.
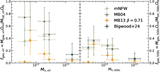
The halo gas fraction within R500c, fgas,500c, vs. halo mass. The colored points are FRB data, including those analyzed in this work—the five FRBs in our sample plus the cluster FRB 20220509G (see the text)—and measurements from the literature. For comparison, we include representative studies from the literature that use complementary observational tools; see the text for details. Note that the data in the different studies represented here are not necessarily from the same redshift.
Other Images in This Article
Copyright and Terms & Conditions
© 2026. The Author(s). Published by the American Astronomical Society.

Copyright ©
2026 Astronomy Image Explorer. All Rights Reserved.
